Member-only story
A Rich Man’s War, a Poor Man’s Fight
Why do the poorest Americans blindly support a self-proclaimed billionaire?
The chart hereunder was shared all over social media in the past few days. It represents the share of Gross Domestic Product (GDP) “won” by each candidate when adding up all the counties that voted for them. Looking at the definition of GDP in an IMF publication, we read that
GDP measures the monetary value of final goods and services — that are bought by the final user — produced in a country in a given period of time.
It also commonly agreed amongst economists that “GDP serves as the key indicator of development and progress.”

The differences between the economic circumstances of those who voted for Biden or Trump are staggering.
While Biden only won about 17% of the country’s counties, they represent 70% of the national GDP. More significantly, Biden won all 32 counties with a GDP over $100B with an average lead of +38.66.

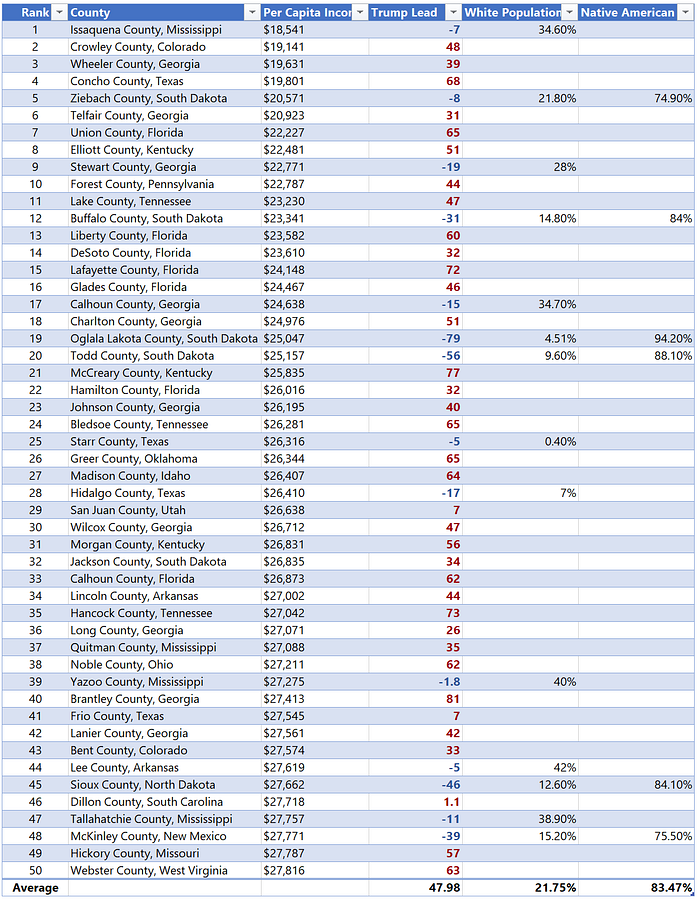
In the meantime, Trump won 83% of the nation’s counties but these only represent 29% of the GDP. Moreover, he also claimed 36 of the 50 counties with the lowest per capita income with an average +47.98 margin. Interestingly, and not surprising at all, the poorest counties that voted for Biden either have a small white population or a large Native American one.
People from the poorest counties in the country vote en masse for Trump and support his fasco-capitalist rhetoric while they stand not only to gain nothing from it but also to lose the very government support they rely on.
Trump supporters tend to rely more on food stamps, as a 2018 Bloomberg article citing an analysis from the same source shows: